Chart Types
Chart Types represent various types of charts that can be used as a dashboard visualization. When creating or editing a visualization, the chart type is chosen from the Chart Types drop-down menu.
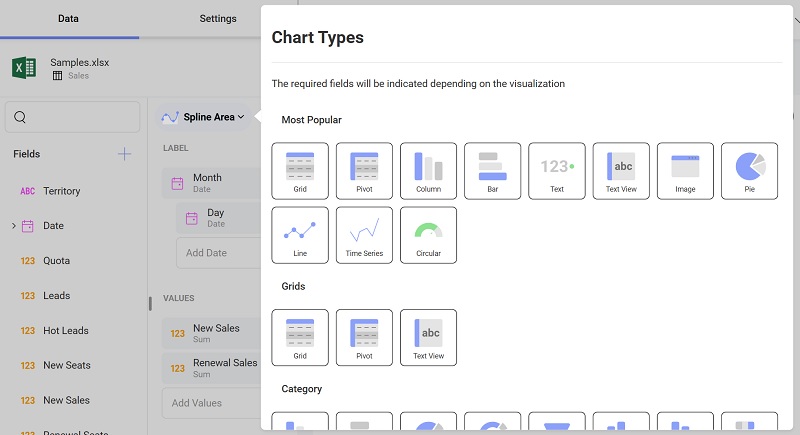
The Reveal SDK provides 37 different types of charts placed in various groups. The groups are as follows:
- Most Popular
- Grids
- Category
- Gauges
- Maps
- Scatter
- Financial
- Time
- Other
Customizing Chart Types
To modify, remove, or add custom visualizations to the chart types drop down, simply modify the items in the RevealView.ChartTypes collection.
Update Chart Type
To update an existing chart type, find the chart type in the RevealView.ChartTypes property. Modify the various properties of the chart type to either rename, change the icon, or regroup the chart type item.
var barConfig = _revealView.ChartTypes.First(x => x.ChartType == RVChartType.BarChart);
barConfig.Title = "My Cool Bar";
barConfig.Icon = "https://help.revealbi.io/img/logo.png";
barConfig.Groups = new string[] { "Enterprise Visualizations", "HR", "Some Other Category" };
Remove Chart Type
Remove a chart type by finding the chart type item you want remove, and remove it from the ChartTypes colelction.
_revealView.ChartTypes.Remove(_revealView.ChartTypes.FirstOrDefault(x => x.ChartType == RVChartType.Grid));
Add Custom Chart Type
Besides updating and removing existing chart type items, you can also add your Custom Visualizations as a new chart type in the Chart Types drop down.
_revealView.ChartTypes.Add(new RVChartTypeCustomItem("Custom Viz", "https://host/customViz.html")
{
    Icon = "https://help.revealbi.io/img/logo.png",
    Groups = new string[] { "Custom Vizualizations" }
});
Set the Default Chart Type
By default, the Reveal SDK sets the ColumnChart chart as the default chart type. You can change the default chart type by setting the RevealView.DefaultChartType property to one of the RVChartType enumeration members.
_revealView.DefaultChartType = RVChartType.StackedColumnChart;
If you want to set the default chart type to a Custom Visualization, then you need to set the RevealView.DefaultCustomChartType property to the title of the custom visualization.
_revealView.DefaultCustomChartType = "Custom Viz";
You can find a sample demonstrating Chart Types on GitHub.