Formatting Dashboard Data
The Formatting service allows you to format your dashboard data to your preferences, ignoring a field formatting.
Supported Elements for Formatting
Dashboard elements you can format:
- Numeric data
- Date, Time or DateTime data
- Aggregated Date, Time or DateTime data
Using the Formatting Service
The dashboard used for the followinf examples is the Marketing sample dashboard.
Formatting numeric data - example
Below you see the initial state of the New Seats by Campaign ID visualization in the Marketing sample dashboard:
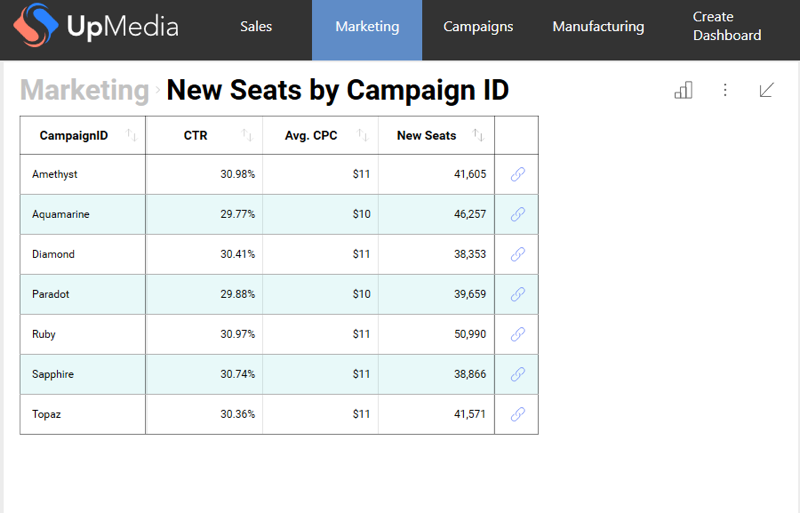
Follow the steps below to format the numeric data to display 5 decimal digits:
-
To be allowed to format the dashboard data, you should set the FormattingProvider property to your custom implementation:
RevealSdkSettings.FormattingProvider = new UpMediaFormattingProvider(); -
Implement the IRVFormattingProvider:
public class UpMediaFormattingProvider : IRVFormattingProvider
{
    public RVBaseFormattingService GetFormattingService()
    {
        return new UpMediaFormattingService();
    }
} -
Override the FormatNumber method in the implementation of the RVBaseFormattingService:
public class UpMediaFormattingService : RVBaseFormattingService
{
    public override string FormatNumber(double value, RVNumberFormattingSpec formatting, bool ignoreMkFormatting)
    {
        return string.Format("{0:0.00000}", value);
    }
}
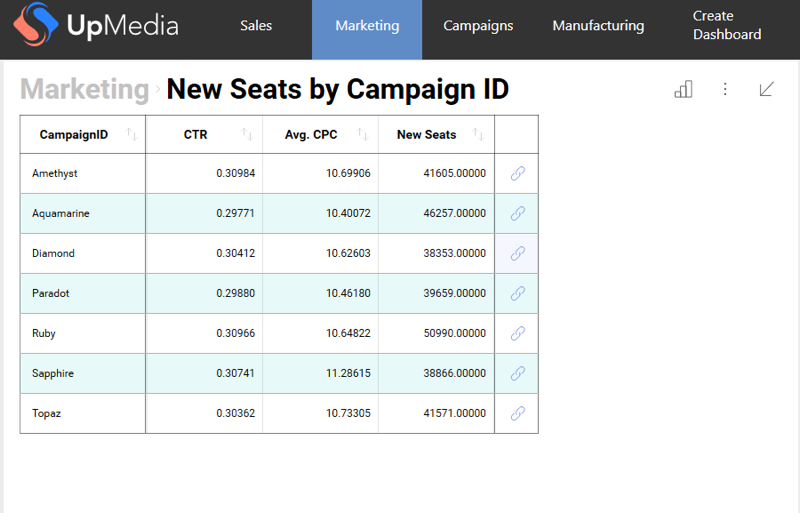
When running the app again you will see that all the numeric data is formatted to display numbers with 5 decimal digits and all other formatting settings (such as whether the field represents currency or percentage) are ignored:
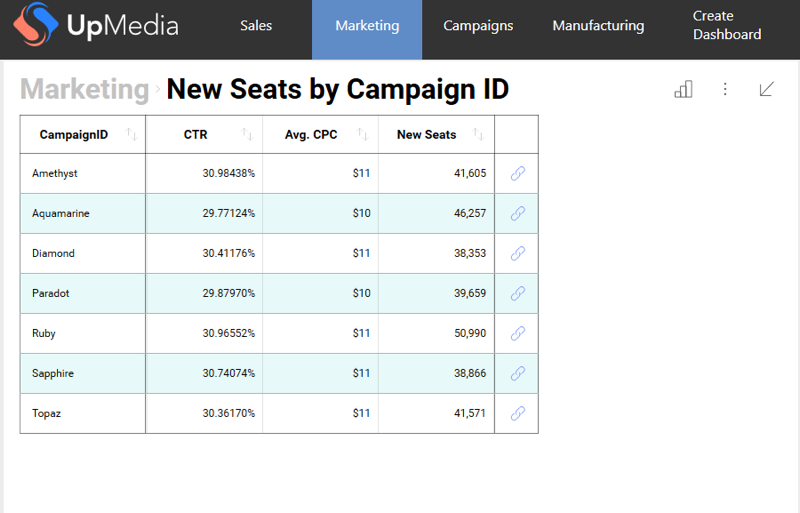
If you want to change the formatting of only the fields displaying percentage, for example, you need to add a check for the type of the numeric field:
public class UpMediaFormattingService : RVBaseFormattingService
{
    public override string FormatNumber(double value, RVNumberFormattingSpec formatting, bool ignoreMkFormatting)
    {
        if (formatting.FormatType == RVDashboardNumberFormattingType.Percent)
        {
            return string.Format("{0:0.00000%}", value);
        }

        return base.FormatNumber(value, formatting, ignoreMkFormatting);
    }
}
Now you have only the percentage fields formatted:
If you take a look at the other visualizations in the dashboard, you will notice that the formatting of the numeric data in them is not changed. In these cases, the formatting is controlled by the chart, so you will have to modify the formatting settings of the fields in order to modify it. You can do this by using the Localization Service.

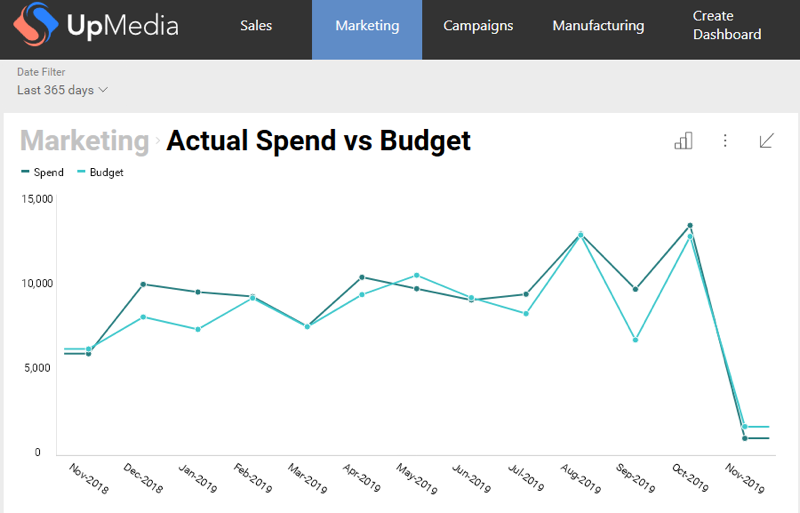
Formatting aggregated DateTime data - example
This is the initial state of one of the Marketing’s sample visualizations – Actual Spend vs Budget:
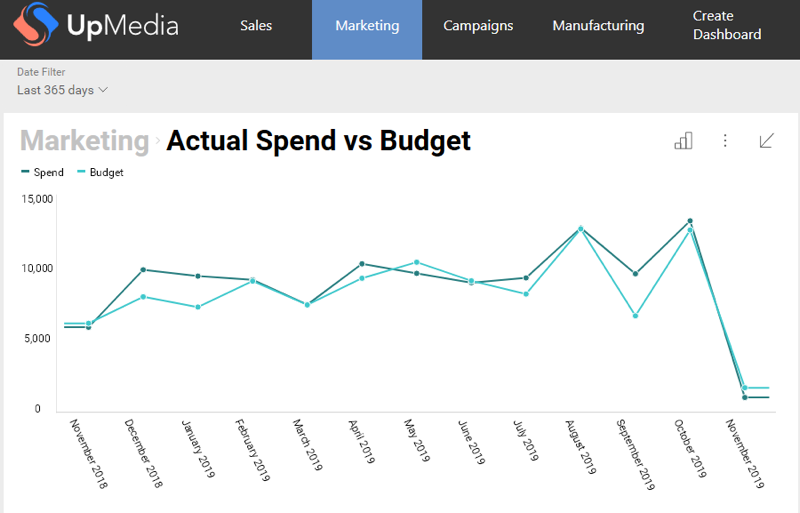
Below, you will see an example of how to format the aggregated date data to show the full month name - for example "January 2001". To do this, you need to override the FormatAggregatedDate method in your implementation of RVBaseFormattingService:
public class UpMediaFormattingService : RVBaseFormattingService
{
    public override string FormatAggregatedDate(DateTime value, RVDashboardDataType type, RVDashboardDateAggregationType aggregation, RVDateFormattingSpec formatting)
    {
        if (aggregation == RVDashboardDateAggregationType.Month)
        {
            return string.Format("{0:MMMM yyyy}", value);
        }

        return base.FormatAggregatedDate(value, type, aggregation);
    }
}
After you run the app again you will see the updated dates:
Formatting (non-aggregated) DateTime data - example
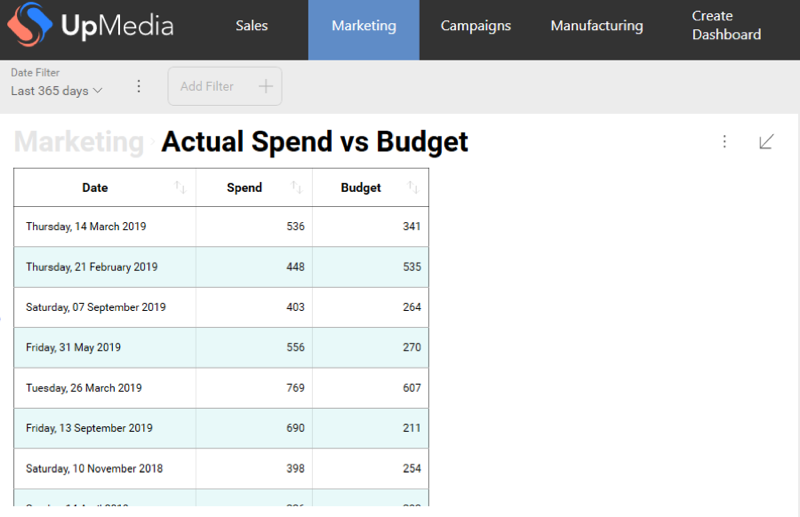
Below you will see an example of how to format non-aggregated date data. First, change the Actual Spend vs Budget visualization to Grid in order to exclude any aggregated data:
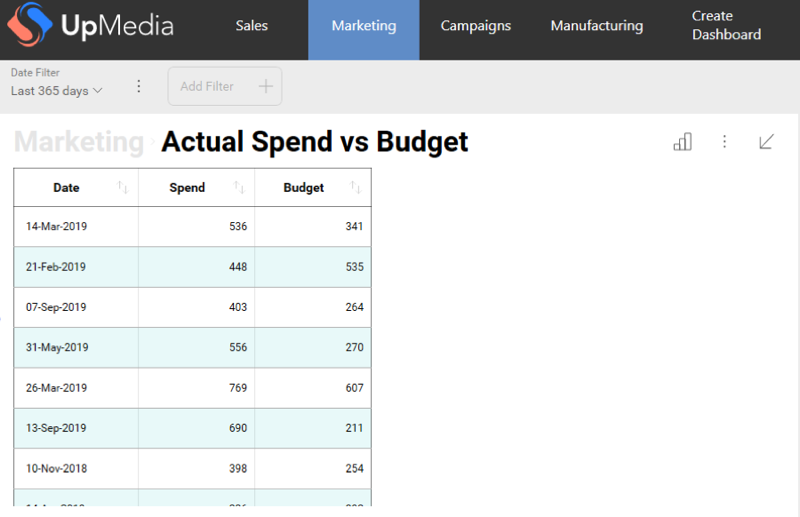
To change how the dates are displayed you have to override the FormatNumber method in your implementation of RVBaseFormattingService. Let’s make the dates containing the day of the week and date – for example "Monday, 01 January 2001":
public class UpMediaFormattingService : RVBaseFormattingService
{
    public override string FormatDate(DateTime value, RVDashboardDataType type, RVDateFormattingSpec formatting, bool localTimeZone)
    {
        return string.Format("{0:dddd, dd MMMM yyyy}", value);
    }
}
And when you run the app again and change the visualization to Grid, you will see the updated dates (you may have to refresh the data because of the caching):