カスタム表示形式
Reveal SDK は、アプリケーションにシームレスに統合される、豊富な種類の事前定義された表示形式を、デフォルトでユーザーに提供します。これらの表示形式は、データを素早く効率的に表示するための手段を提供します。ただし、特殊な状況や特別なケースでは、特有の要件に従ってデータの表示をカスタマイズする必要がある場合があります。このような場合、Reveal SDK はカスタム表示形式を通じてソリューションを提供します。
カスタム表示形式は、自由に定義できる特注のコンポーネントとして機能します。これらのコンポーネントは Reveal SDK から直接データを受け取ることができ、標準にはない高度にカスタマイズされた方法で情報を表示できるようになります。このようなカスタマイズにより、アプリケーションの特定の視覚的および分析的ニーズを確実に満たすことができ、よりカスタマイズされたユーザー中心のエクスペリエンスを提供できます。特殊なチャート、独自のグラフ、またはデータの独特な表現のいずれであっても、カスタム表示形式は、真にパーソナライズされた効果的なデータ プレゼンテーション ソリューションを作成するためのツールを開発者に提供します。
カスタム表示形式を作成するには、事前定義されたコンポーネント (表示形式が描画する方法を示す) とブリッジ (コンポーネントと Reveal SDK によって管理されるデータとの間の接続として機能する) の両方が必要です。ブリッジはデータ変更のイベントを公開する必要があり、コンポーネントはこのイベントをサブスクライブして更新されたデータを取得する必要があります。
ブリッジのセットアップ
上記に記述した通り、SDK からのデータを使用するには、ブリッジを定義する必要があります。以下は、ブリッジがどのように構造化されるかを示し��ています。
var host;
window.revealBridge = {
  sendMessageToHost: function (data) {
    try {
      if (window.parent && window.parent.location) {
        window.parent.postMessage(data, "*");
      }
    } catch (e) {
      // window.parent.postMessage couldn't be executed.
      // This sould never happen but...
    }
  },

  notifyExtensionIsReady: function (formatting) {

    if (formatting) {
      this.sendMessageToHost({ message: "ready", formatting: true });
    } else {
      this.sendMessageToHost({ message: "ready" });
    }
  },
}

function processMessageFromHost(message) {
  if (!message || !message.data || !message.data.metadata) {
    return;
  }

  if (message.data.message) {
    // This is the same message that I'm sending to notify that the extension is ready and the iPad is sending it back here.
    return;
  }

  if (!window.revealBridgeListener) {
    return;
  }

  window.revealBridgeListener.dataReady(message.data);
};

window.addEventListener('message', processMessageFromHost, false);
カスタム表示形式の定義
この例では、Angular を使用しています。Angular コンポーネントを作成しましょう。コンポーネント内には、ブリッジで事前に定義された window.revealBridgeListener のイベント ハンドラーを含める必要があります。
export class TableComponent implements OnInit {

    data: any = [];
    headers: any = [];

    constructor(private ref: ChangeDetectorRef) { }

    ngOnInit(): void {
        window.revealBridgeListener = {
            dataReady: (incomingData: any) => {
                this.data = this.dataToJson(incomingData);
                this.createTableHeaders(this.data);
                this.ref.detectChanges();
            }
        };
        window.revealBridge.notifyExtensionIsReady();
    }

    createTableHeaders(data: any) {
        if (data.length === 0) {
            return;
        }

        Object.keys(this.data[0]).map((propertyName: string) => {
            this.headers.push(propertyName)
        })
    }

    dataToJson(data: any) {
        let propertyNames = [];

        if (!data.metadata.columns) {
            return [];
        }

        for (var c = 0; c < data.metadata.columns.length; c++) {
            var column = data.metadata.columns[c];
            propertyNames.push(column.name);
        }

        let dataObjects = [];
        for (var i = 0; i < data.data.length; i++) {
            var rowData = data.data[i];
            let dataObject: any = {};
            for (var j = 0; j < rowData.length; j++) {
                dataObject[propertyNames[j]] = rowData[j];
            }
            dataObjects.push(dataObject);
        }

        return dataObjects;
    }
}
これで、必要に応じてデータを表示する準備が整いました。以下はテンプレートを表しています。
<div class="container">
    <table>
        <thead>
        <tr>
            <th *ngFor="let header of headers">{{header}}</th>
        </tr>
        </thead>
        <tbody>
        <tr *ngFor="let row of data">
            <th *ngFor="let header of headers">{{ row[header] }} </th>
        </tr>
        </tbody>
    </table>
</div>
最後の手順として、このように定義したコンポーネントを参照して、カスタム表示形式を SDK に登録する必要があります。このコードは、Reveal ビューを含むコンポーネント内で呼び出す必要があります。
RVChartTypeItem オブジェクトを revealView.chartTypes 配列に追加します。必須のプロパティ (title、url、icon、および groups) を必ず指定してください。url プロパティは、定義したコンポーネントの場所を参照する必要があります。
チャート タイプの登録について、追加情報が必要な場合は、カスタム チャート タイプの追加に関するドキュメントを参照してください。
export class DashboardViewerComponent implements AfterViewInit {

    @ViewChild('revealView') el!: ElementRef;

    async ngAfterViewInit() {
        let dashboard = await $.ig.RVDashboard.loadDashboard("Sales");
        var revealView = new $.ig.RevealView(this.el.nativeElement);
        revealView.dashboard = dashboard;

        //add custom vizualization to chart types drop down
        revealView.chartTypes.push({
            title: "HTML Table",
            url: "http://localhost:4200/table", //provide the url to your custom vizualization
            icon: "https://help.revealbi.io/img/logo.png",
            groups: ["Custom Vizualizations"]
        });
    }
}
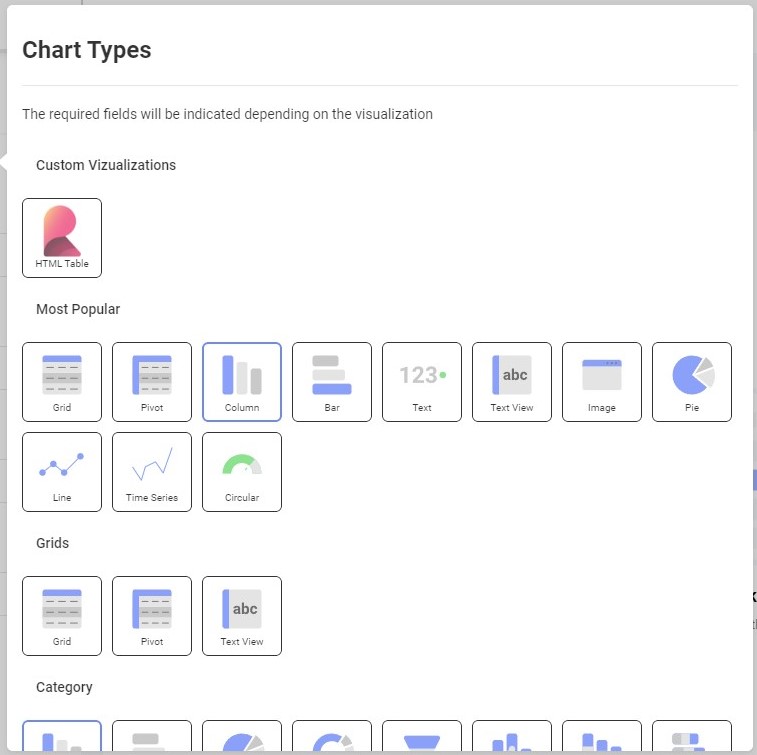
[チャート タイプ] ドロップダウンに、追加した表示形式が表示されます。
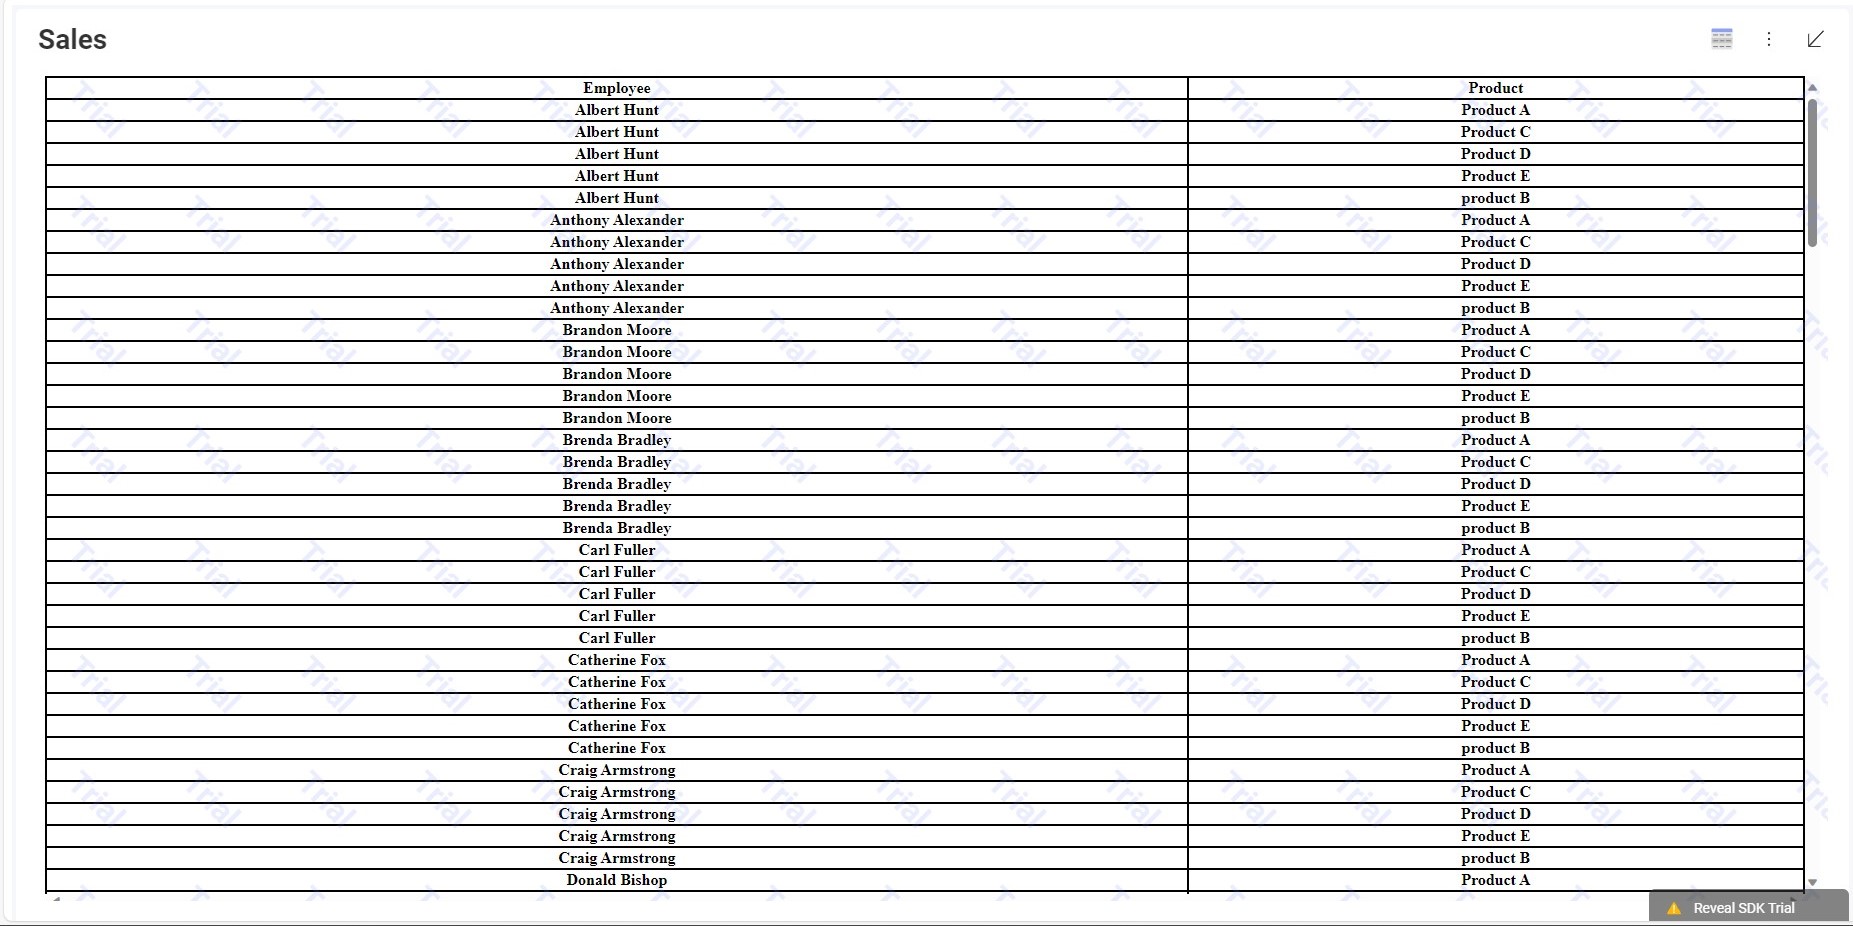
表示形式がダッシュボードに追加されると、次のようになります:
このサンプルのソース コードは GitHub にあります。