Maximizing Visualizations and Single Visualization Mode
Overview
When displaying a dashboard to the user, there are some cases in which you’d like to display just one maximized visualization. In addition, you might also want to lock the initial visualization and prevent the user from accessing the whole dashboard. You can achieve both scenarios using the Web Client SDK.
Example Details
Let’s assume that you have a dashboard with three visualizations, where each visualization is showing data for a different division of your company, i.e., “Marketing”, “Sales” and “HR”.
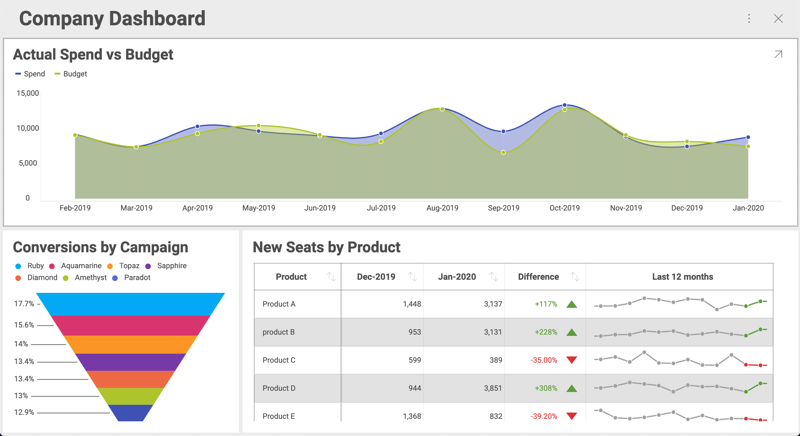
In this example, you’d like to showcase these visualizations in your corporate application. You want to include them as part of the information displayed on each division’s home page.
Maximizing Visualizations
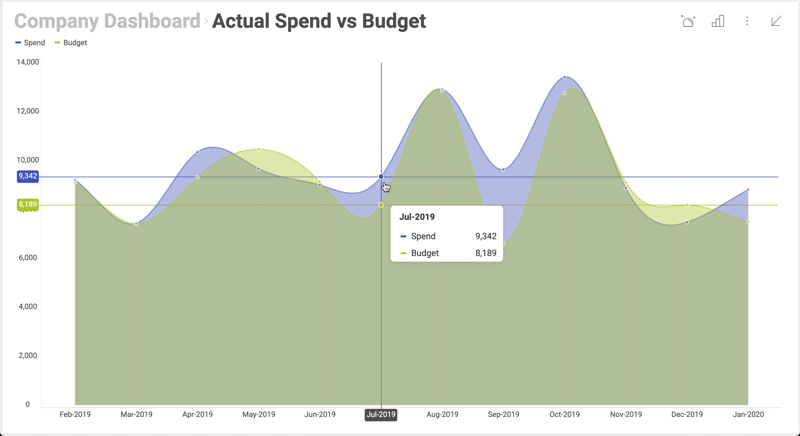
To open a dashboard with a maximized visualization, you need to set the dashboard property of revealView. Then, set the maximizedVisualization property by passing the visualization you want maximized to the $.ig.RevealView instance. When you don’t set a visualization in this attribute, the whole dashboard is displayed.
$.ig.RVDashboard.loadDashboard("AllDivisions", function (dashboard) {
    var revealView = new $.ig.RevealView("#revealView");
    revealView.dashboard = dashboard;
    revealView.maximizedVisualization = dashboard.visualizations.getByTitle('Sales');
});
Although the initial maximized visualization will be the one with title ‘Sales’, the end user can still return to the dashboard and see the rest of the visualizations.
Single Visualization Mode
You may also want to lock the initial visualization, making it the only one displayed at all times. This way the dashboard works like a single visualization dashboard. This is the concept behind “single visualization mode”.
To turn on the “single visualization mode”, just set the singleVisualizationMode to true as shown below.
revealView.singleVisualizationMode = true;
After adding this single line, the dashboard will work as a single visualization dashboard. You can do the same for each division’s home page, just replace the title of the visualization in dashboard.visualizations.getByTitle() with the right one.
Dynamically changing a locked visualization
It is also possible for you to dynamically change the single visualization being displayed, without reloading the page. From the user’s perspective, your app would be a single page application with a selector of divisions and a maximized visualization. After the user chooses one division from the list, the maximized visualization is updated.
You can achieve this scenario by using the maximizeVisualization method in $.ig.RevealView, as shown below:
<section style="display:grid;grid-template-rows:30px auto;">
    <section style="display:grid;grid-template-columns:auto auto auto;">
        <button onclick="maximizeVisualization('Sales')">Sales</button>
        <button onclick="maximizeVisualization('HR')">HR</button>
        <button onclick="maximizeVisualization('Marketing')">Marketing</button>
    </section>
    <div id="revealView" style="height:500px;" />
</section>
var dashboardId = 'AllDivisions';

$.ig.RVDashboard.loadDashboard(dashboardId, function (dashboard) {
    var revealView = window.revealView = new $.ig.RevealView("#revealView");
    revealView.singleVisualizationMode = true;
    revealView.dashboard = dashboard;
    revealView.maximizedVisualization = dashboard.visualizations.getByTitle('Sales');

});

function maximizeVisualization(title) {
    var dashboard = window.revealView.dashboard;
    window.revealView.maximizedVisualization = dashboard.visualizations.getByTitle(title);
}
To take into account:
- The $.ig.RevealView object is set in _window.revealView</emphasis> in order to use it later when maximizeVisualization property is set.
- The buttons added to the section before the div are used just as an example. They were added as a means to switch the maximized visualization, in your case you’ll have to to use a similar code in your application.
- In this example, the buttons are hardcoded to match the visualizations in the sample dashboard, but you can also generate the list of buttons dynamically by iterating the list of visualizations in the dashboard. For further details see $.ig.RVDashboard.visualizations.